How to debug Magento 2

This blog posts contains vital information on Magento 2 debugging. Below, you will find Magento 2 tutorials related to Xdebug Magento 2 configuration, Magento 2 logging, enabling template path hints as well as a short list of free Magento 2 debugging tools.

Let’s start with Xdebug, since it is one of the most reliable and robust tools for Magento 2 debugging. On Mageclass, there is a good explanation of Xdebug configuration for Magento 2 with the help of Sublime Text and PhpStorm. Unfortunately, it is impossible to debug Magento 2 with Xdebug only, therefore additional tools are required. Both variants are described here: . Check the article for further information.
While talking about Magento 2 debugging, we should also mention such important process as Magento 2 logging. Logging variables or custom messages is inevitable during debugging, that’s why you should know how to create a custom log in Magento 2. The system utilizes a Monolog library to provide built-in log facilities; as for the configuration procedure, it won’t take too much time. Magento 2 logging is fully described on Inchoo here: .
Enabling template path hints is another procedure required for the debugging of Magento 2. Although it is described in our Magento 2 Developer’s Cookbook (you can also find tons of other useful tips related to Magento 2 there), we will described it below again.
In addition to enabling template path hints in Magento 2 you can also display block names. Go to your Admin -> Stores -> Configuration -> Developer; then, select a specific store scope; and finally set “Template page hints” and “Add block names to hints” to Yes. You will immediately notice changes in both frontend and backend: check some images in the Cookbook.
Table of contents
Magento 2 debugging tools
Below, there is a short list of free debugging tools compatible with Magento 2.
Z-Ray by Zend Server
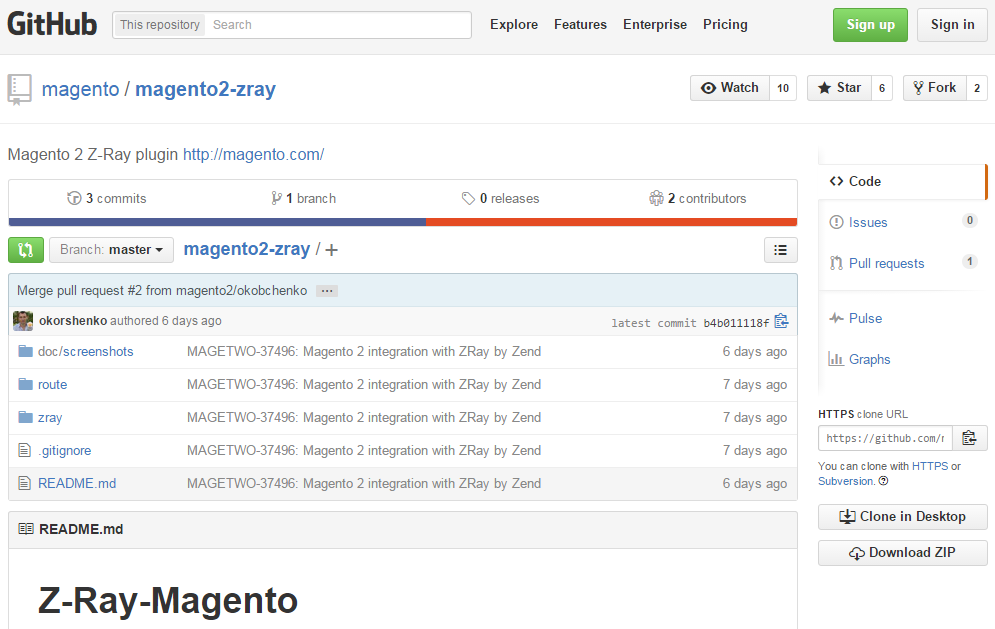
With the Z-Ray tool you will enhance your Magento 2 admin with powerful features for PHP files profiling. Having installed the Magento 2 Z-Ray plugin you get the ability to track heavy constructors, blocks rendering calls, behavior extension by plugins, number of observers listening to specific event and time on their execution. For further information, check Zend’s website, for the installation procedure follow .
Source: ;
Magento 2 Developer Debug Tool by CedCommerce
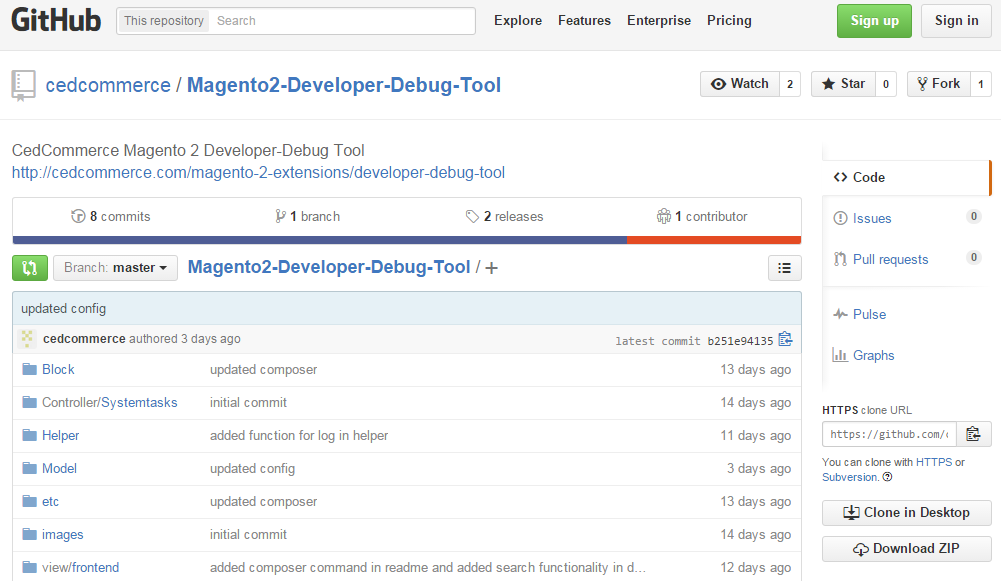
Magento 2 Developer-Debug Tool is an extension for fetching crucial information related to a page load. It provides a complete set of data about every current page request:
- collections and models;
- observer and events;
- extended and parent classes;
- blocks.
You can get Magento 2 Developer-Debug Tool on the official website or download it for free from GitHub
Source: ;
Useful Commands
To enable developer mode, use the following command:
|
1 |
php bin/magento setup:mode:set developer |
For the Magento 2 Profiler, run the command below:
|
1 |
SetEnv MAGE_PROFILER "html" |
You can find more Magento 2 commands here: Magento 2 Command Line Tool.
Related posts
 Magento 2 Release Notes
 Magento 2 B2B Company Guide: Revealing Company Structure & Import
 How to Import Customers & Customer Addresses to Magento 2
 Adobe (Magento 2) Commerce and Cloud (Enterprise Edition) Specific Features
 How To Bulk Import Products In Shopify: CSV Description & Step-By-Step Guide
 CopyAI Review 2023
 A Complete Guide to Shopify Customer Import
 Reputon Amazon Importer Review: How to Connect Shopify to Amazon in a Few Clicks