
Introduction to Stathubs – Centralized eCommerce Analytics Dashboard
In today’s digital marketplace, where ecommerce brands juggle multiple tools for analytics, ads, and platform management, StatHubs arrives as a much-needed game-changer. With seamless integration across major ecommerce systems and ad platforms, StatHubs centralizes performance data into one powerful, real-time dashboard. The result? Businesses finally get the clarity they need to make data-driven decisions without the friction of platform switching. Whether you run a single-brand store or oversee a network of online shops, StatHubs helps you unlock insights across sales, marketing, and analytics in ways that drive real, measurable growth.
Managing an online store means juggling data from sales platforms and marketing channels. Traditionally, merchants must check separate reports in Shopware, Shopify, Magento or Google Analytics, making it hard to get a unified view of performance. As Firebear’s analytics guide notes, “eCommerce analytics is the procedure of collecting data for your online store in order to make data-driven decisions and boost online sales” However, this data often ends up scattered across tools, so teams only see “one piece of the larger puzzle”. Stathubs solves this by acting as a single analytics dashboard that consolidates sales, orders, traffic, and ad campaigns from all channels.
StatHubs’ core value is giving merchants a full 360-degree view of their business in real time. Instead of logging into multiple platforms, store owners, agencies, and marketers log into Stathubs to see everything at once. This positioning sets it apart as an “eCommerce analytics dashboard tool” that simplifies decision-making. By centralizing data and alerts in one app, Stathubs helps users catch issues early, track KPIs continuously, and focus on growth strategies rather than manual data wrangling.

Table of contents
Benefits of Using Stathubs
Using Stathubs brings multiple advantages to eCommerce operations. Key benefits include:
- Centralized Insights & Unified Data: StatHubs pulls together metrics from all sales platforms and marketing tools into one dashboard. As explained, an analytics dashboard “collects data from multiple sources and integrates them into a single dashboard for a centralized view”. This unified approach eliminates data silos and shows “an instant, unified view of sales, marketing, customers and products”. With all data in one place, businesses can compare performance across channels without switching apps.
- Real-Time Performance Monitoring: StatHubs provides live updates on key indicators so teams can respond immediately. Dashboards are always “fresh,” meaning teams have “instant access to fresh insights” and can address challenges without delays. Real-time data means decisions are based on current facts. For example, merchants can watch daily sales, conversion rates or ad spend as it happens, avoiding reliance on outdated reports.
- ROI Clarity: By combining sales and marketing spend data, StatHubs clearly links investment to outcome. Marketing Intelligence experts stress that fragmented data makes proving ROI difficult, but a unified view “ingests and transforms marketing data into timely insights” that boost campaign ROI. In Stathubs, users see ad spends (Google, Meta, etc.) alongside resulting sales and profit. This transparency helps justify budgets and shift resources to the best-performing campaigns. Clear ROI tracking also means less wasted spend, echoing Salesforce’s guidance on connecting marketing efforts to revenue.
- Cross-Platform Visibility: Businesses often sell on multiple platforms (e.g., Magento and Shopify) and advertise on several channels. StatHubs gives a single-pane view of all channels so nothing is missed. It integrates across every store and every media source, making it easy to see overall trends and how one channel influences another.
- Growth Scalability: As a business grows, keeping up with data becomes harder. Stathubs scales with your business by supporting dozens of stores and millions of visitors without manual effort. Because it automates data collection and analysis, teams save time and avoid errors that come from handling spreadsheets. This efficiency lets companies focus on strategic growth. In fact, unified dashboards often include forecasting tools and machine learning to anticipate trends. With StatHubs, merchants gain actionable projections (e.g. which products may trend, or how a marketing channel will perform), enabling proactive planning rather than reactive scrambling.
Use Cases
StatHubs supports a variety of daily workflows for different users:
- Store Owners: E-commerce owners can monitor overall store health at a glance. They use StatHubs to check sales vs targets, spot low-inventory items, and detect dips in traffic or conversion (with instant alerts). For example, one use might be inventory planning: combining sales data and trends helps predict stock needs. Owners also use Stathubs to analyze conversion funnels – comparing, say, cart abandonment vs completed sales – and then test improvements. Since the app shows revenue and order numbers in context, it helps them answer questions like “Which products or campaigns are driving our sales today?”. Having orders, visitors, and ad performance in one dashboard saves owners from toggling between Magento reports and ad platforms.
- Marketing Teams: Marketers benefit from unified campaign analytics. Instead of guessing which ads perform, they see all marketing spend metrics (e.g. clicks, conversions, ROAS) alongside sales. For example, StatHubs displays Google Ads and Meta Ads metrics side-by-side with store revenue and profit. This lets marketers measure which channel delivers better cost-per-acquisition or return-on-ad-spend at a glance. They can also drill into time comparisons (daily/weekly/monthly) to evaluate promotions or content. By having “customer acquisition and marketing strategies with powerful attribution, profitability and lifetime value reporting”, teams can adjust budgets instantly – e.g. pausing low-performing ads or doubling down on winners. Real-time monitoring also enables quick reaction to market changes (a sudden drop in traffic or surge in demand), keeping marketing agile.
- Agencies: Digital and creative agencies managing multiple clients find StatHubs invaluable. It serves as a white-label or shared analytics platform. An agency can add each client’s store (Magento, WooCommerce, etc.) into StatHubs and quickly toggle between them. The centralized “All Shops” view (see Interface below) lets agencies switch context but maintain an overview of every client’s performance. This means aggregated reporting becomes automated; agencies no longer pull data from each client’s platforms manually. In practice, an agency may set alerts for each client’s KPIs and get notified of issues (e.g., unusual traffic drop). As Glew notes, agencies need to “get insights to drive growth for your clients, in one place,” and StatHubs delivers that single-pane, multi-client dashboard. Delivering monthly reports is also simpler: agencies can generate clear charts and comparisons for clients directly from StatHubs data.
- Developers & Technical Teams: Stathubs reduces developer workload by using APIs and plugins to gather data automatically. For example, it connects to Magento or Shopify via official APIs or to Shopware through a plugin (see Integrations). This means developers don’t have to build custom data syncs or export scripts. Instead of creating bespoke reports in code, developers can focus on connecting APIs. Even non-technical users can add new stores via the StatHubs interface (entering API keys or scanning QR codes). Developers appreciate that Stathubs can import a variety of data (orders, products, customers, etc.) through standard protocols (Rest/SOAP, CSV, etc.) – similar to how Firebear’s own Improved Import & Export handles data formats. By abstracting the heavy lifting of data consolidation, Stathubs lets developers spend time on feature development and custom integrations rather than analytics plumbing.
Integration Overview
StatHubs supports all major eCommerce platforms and marketing tools out of the box. Integration is designed to be quick and seamless:
- E-commerce Platforms: Magento (1 & 2), Shopify, Shopware 5, Shopware 6, WooCommerce, and BigCommerce. For each platform, StatHubs either provides a native plugin or connects via API keys. For example, Magento 2 stores can use StatHubs by installing a small connector module or entering API credentials in the StatHubs app. Shopify shops can connect by granting API access (API key/secret). Similarly, WooCommerce and BigCommerce connect via token-based APIs. These integrations pull in store data (orders, products, customers, categories, CMS pages, promotions, etc.), typically on an hourly or real-time sync. Because Stathubs was built for eCommerce, its integrations cover both sales data and order statuses. Integration is one-time: once credentials (Client Key/Secret, Webhook URL, etc.) are entered, StatHubs automatically fetches new data. This process is “as easy as connecting your data just once, and [having it] automatically updated”, meaning no manual imports after setup.
- Marketing & Analytics Tools: Google Analytics (Universal Analytics and GA4), Google Ads, Meta (Facebook/Instagram) Ads, and more. Merchants link their accounts by authenticating with Google or Facebook APIs. After permission, StatHubs retrieves campaign cost, clicks, conversions, and revenue attribution data. For example, Google Ads integration brings in daily spend and conversions, while Meta Ads integration (via Meta Business SDK) supplies breakdowns of click-through rates and ad revenue. Optionally, other tools like TikTok or email marketing services can be added (depending on StatHubs’ connectors). Unified dashboards mean that once linked, all marketing metrics flow into StatHubs alongside store data. This provides unified marketing insights – marketers see campaign ROAS and cost-per-acquisition side-by-side with store revenue. As industry guides note, connecting all marketing data is vital: you can’t optimize campaign spend or understand channel effectiveness without it. StatHubs handles the integration detail so you get all key metrics “automatically updated” without jumping between platforms.
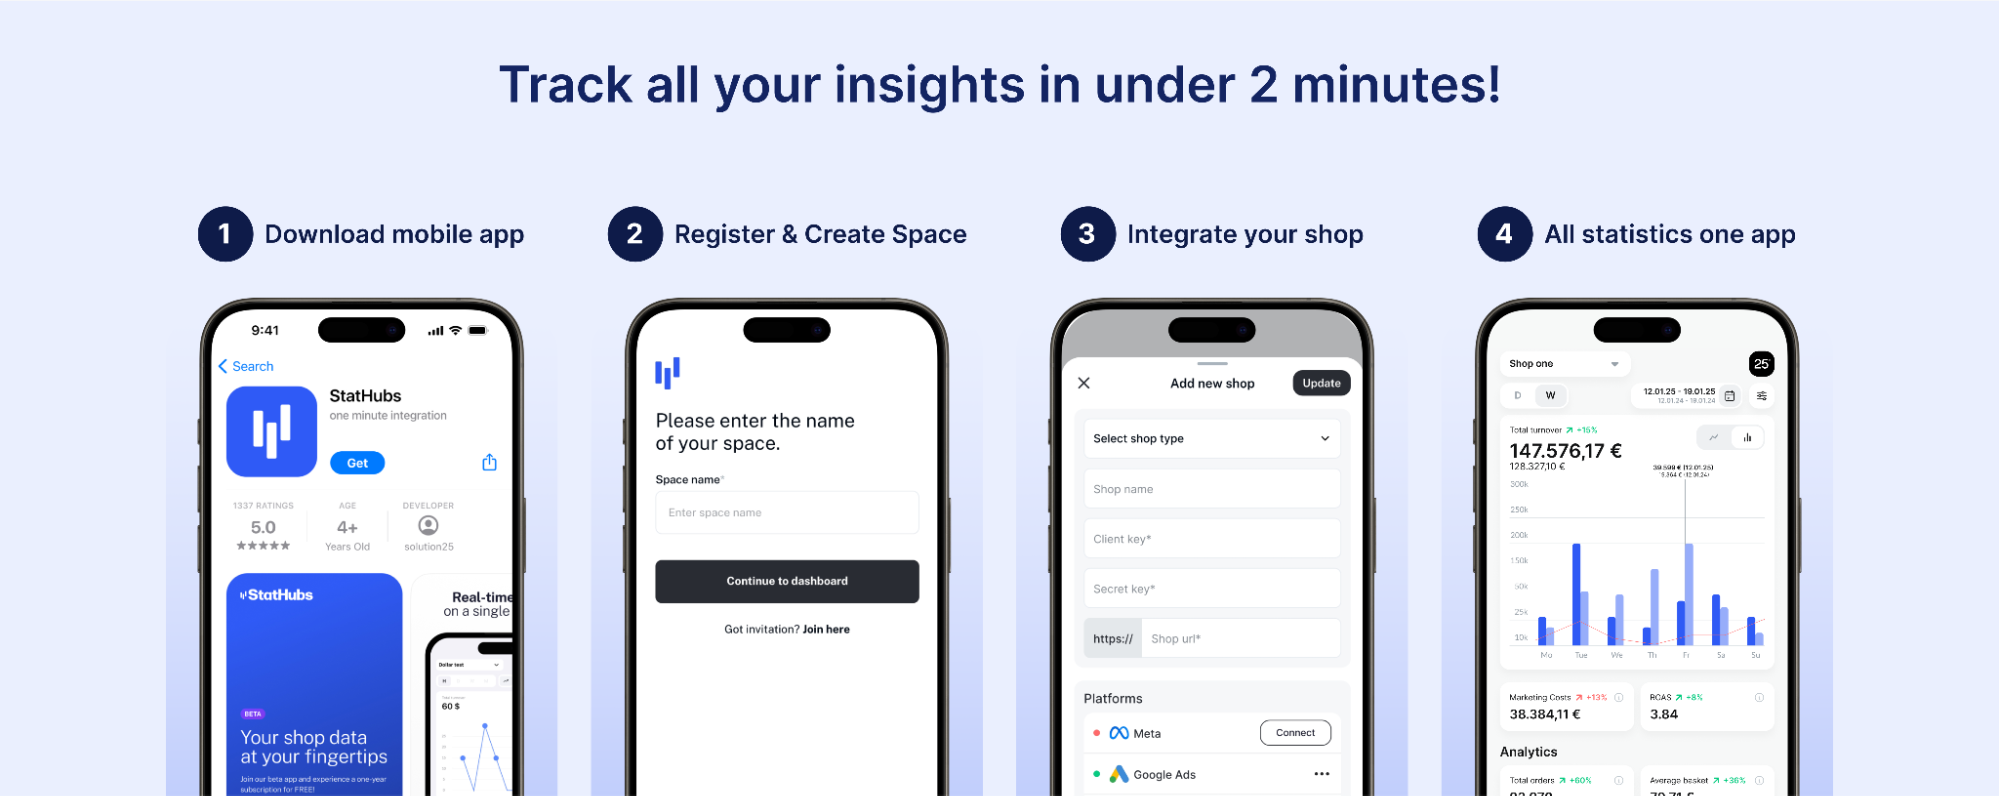
- How It’s Seamless: The integration workflow is built for simplicity. StatHubs’ mobile and web app offers a guided “Add New Shop” wizard: choose your shop system, enter the store URL and API keys (or scan a QR code from the plugin), and click “Create Shop”. The platform then verifies credentials and begins syncing. Likewise, linking an ad account uses standard OAuth flows. Because StatHubs has native support for each listed platform, it abstracts away the tedious parts of data collection. The Shop Details screens let you edit shop info or connect/disconnect any marketing channel with one click, as shown below. This design ensures adding or switching stores doesn’t require developer intervention, making it as quick as a few form entries and button clicks.
Interface & Features Walkthrough
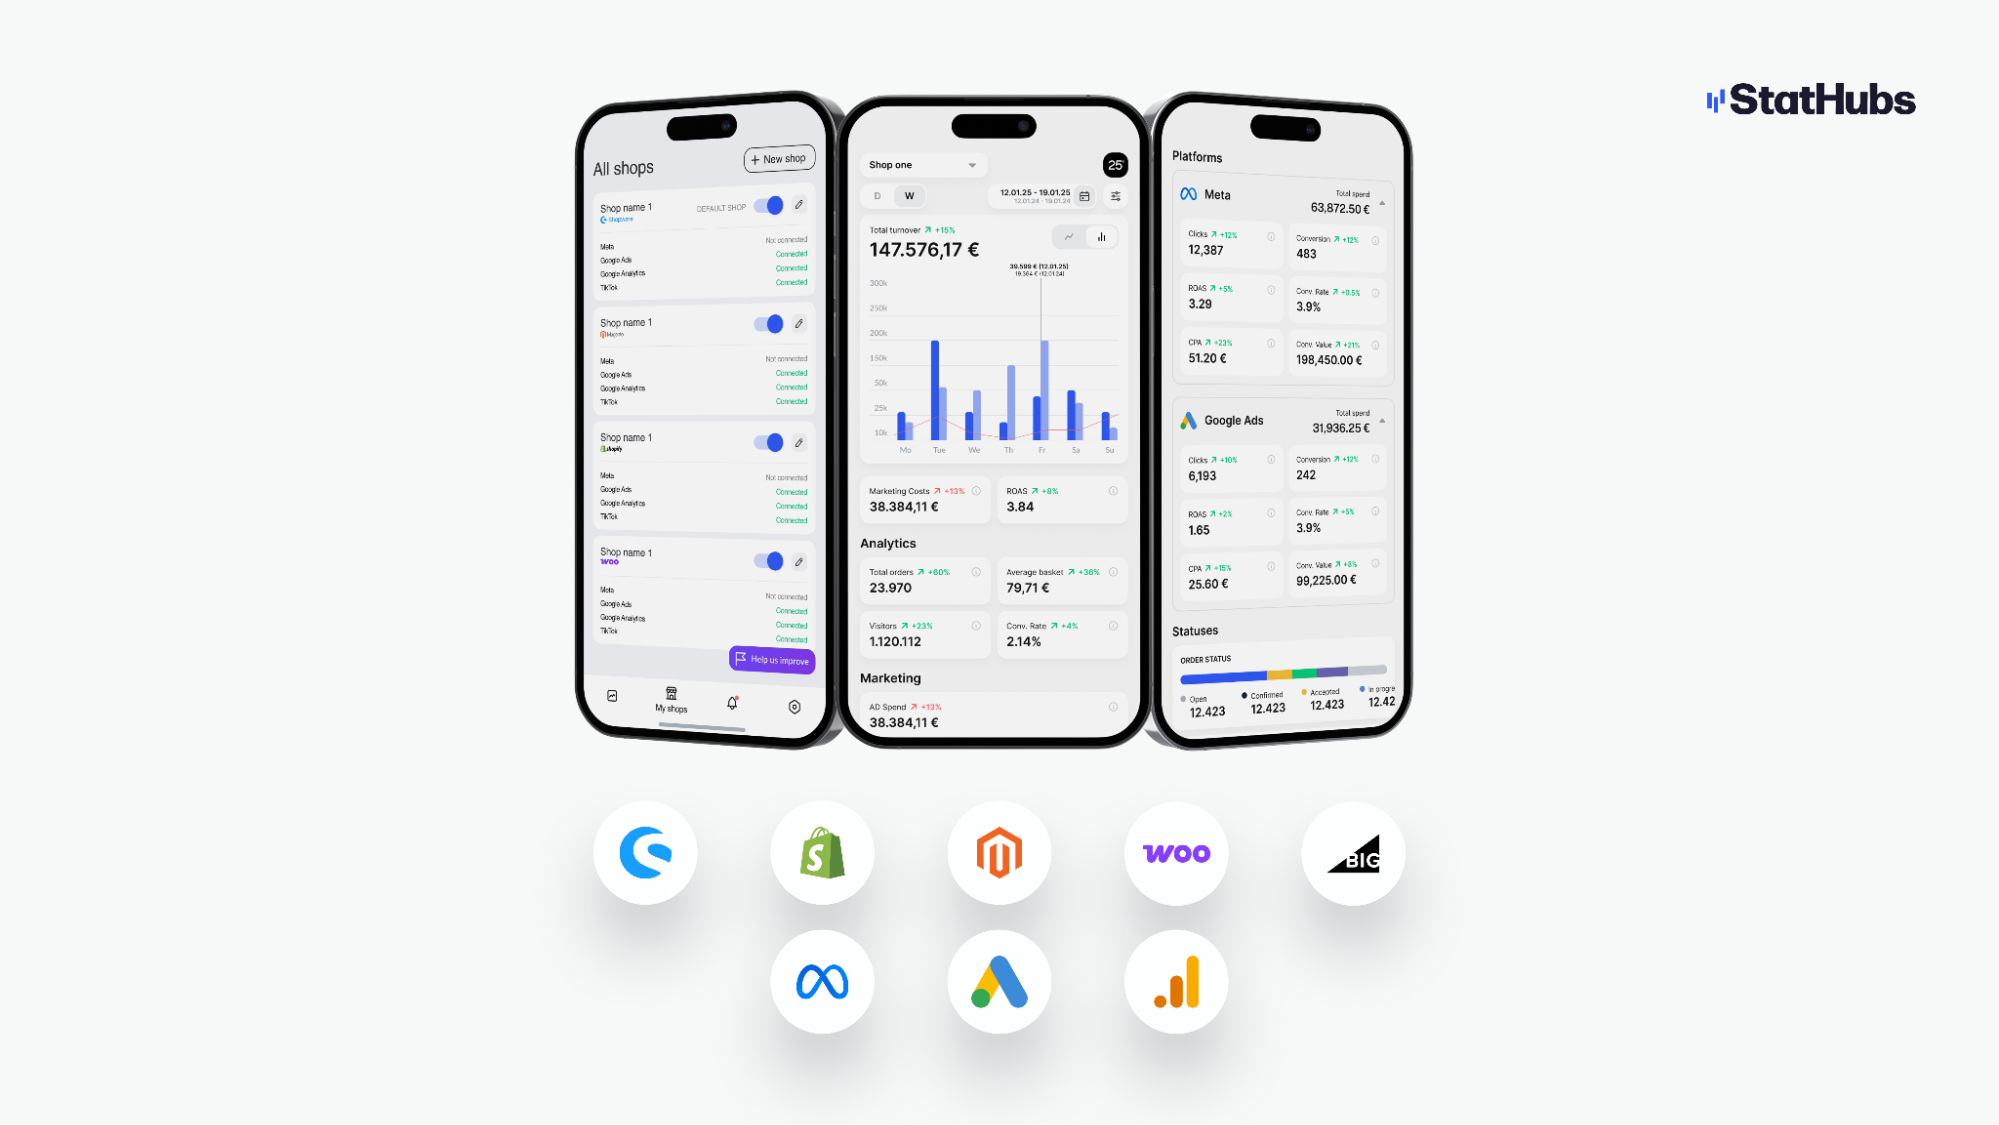
StatHubs’ dashboard is clean and mobile-friendly, presenting critical metrics in intuitive cards and charts. At the top you can select which shop (store) and time period to view; the example above shows “Shop one” for a week-long range. The main panel displays Total Turnover (total sales) with a percentage change from the previous period. A color-coded bar chart breaks sales down by day. Below, a Comparison section directly contrasts total sales with total ad spend for that period, letting you immediately gauge cost-to-revenue ratios.
Key features visible in the screenshot include:
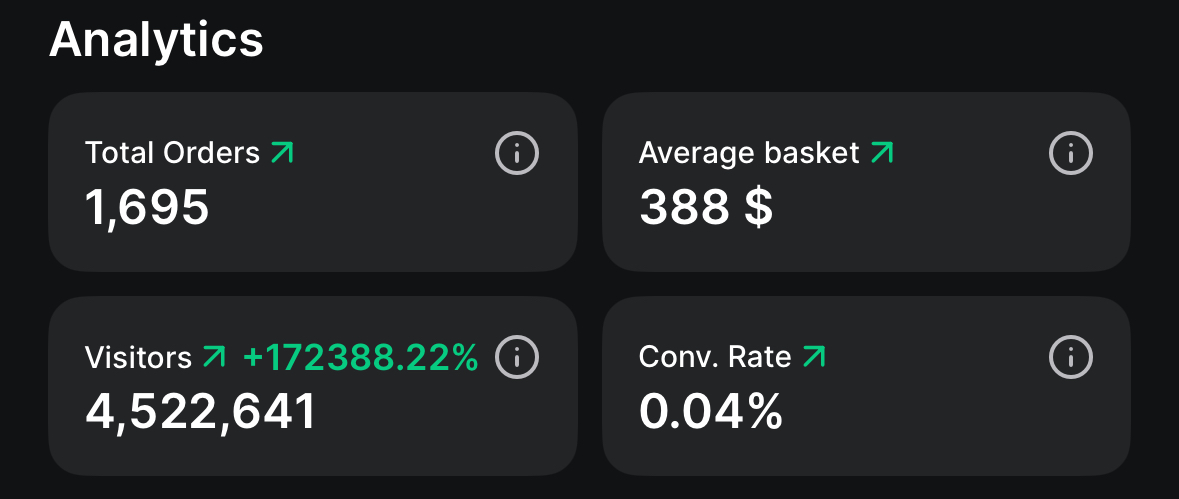
- Analytics Cards: Metrics like Total Orders, Average Basket, Visitors, and Conversion Rate are shown with live values and variance percentages. These snapshot figures update in real time, so users see the current week’s orders or traffic instantly.
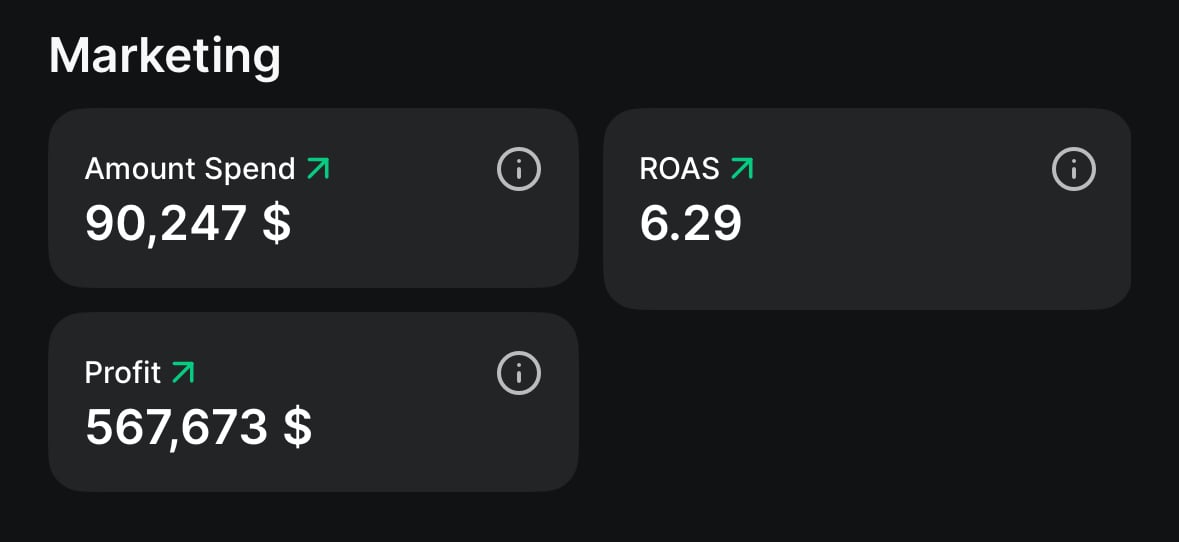
- Marketing Summary: The Marketing section highlights Ad Spend, ROAS, Marketing Cost, and Profit After Marketi ng. Sparkline charts visualize trends (e.g. spend over days) and ROI calculations. For instance, ROAS (Return on Ad Spend) is computed and displayed in the dashboard (see “ROAS 3.33 +13%” in the example). This gives marketers quick insight into campaign effectiveness without leaving StatHubs.
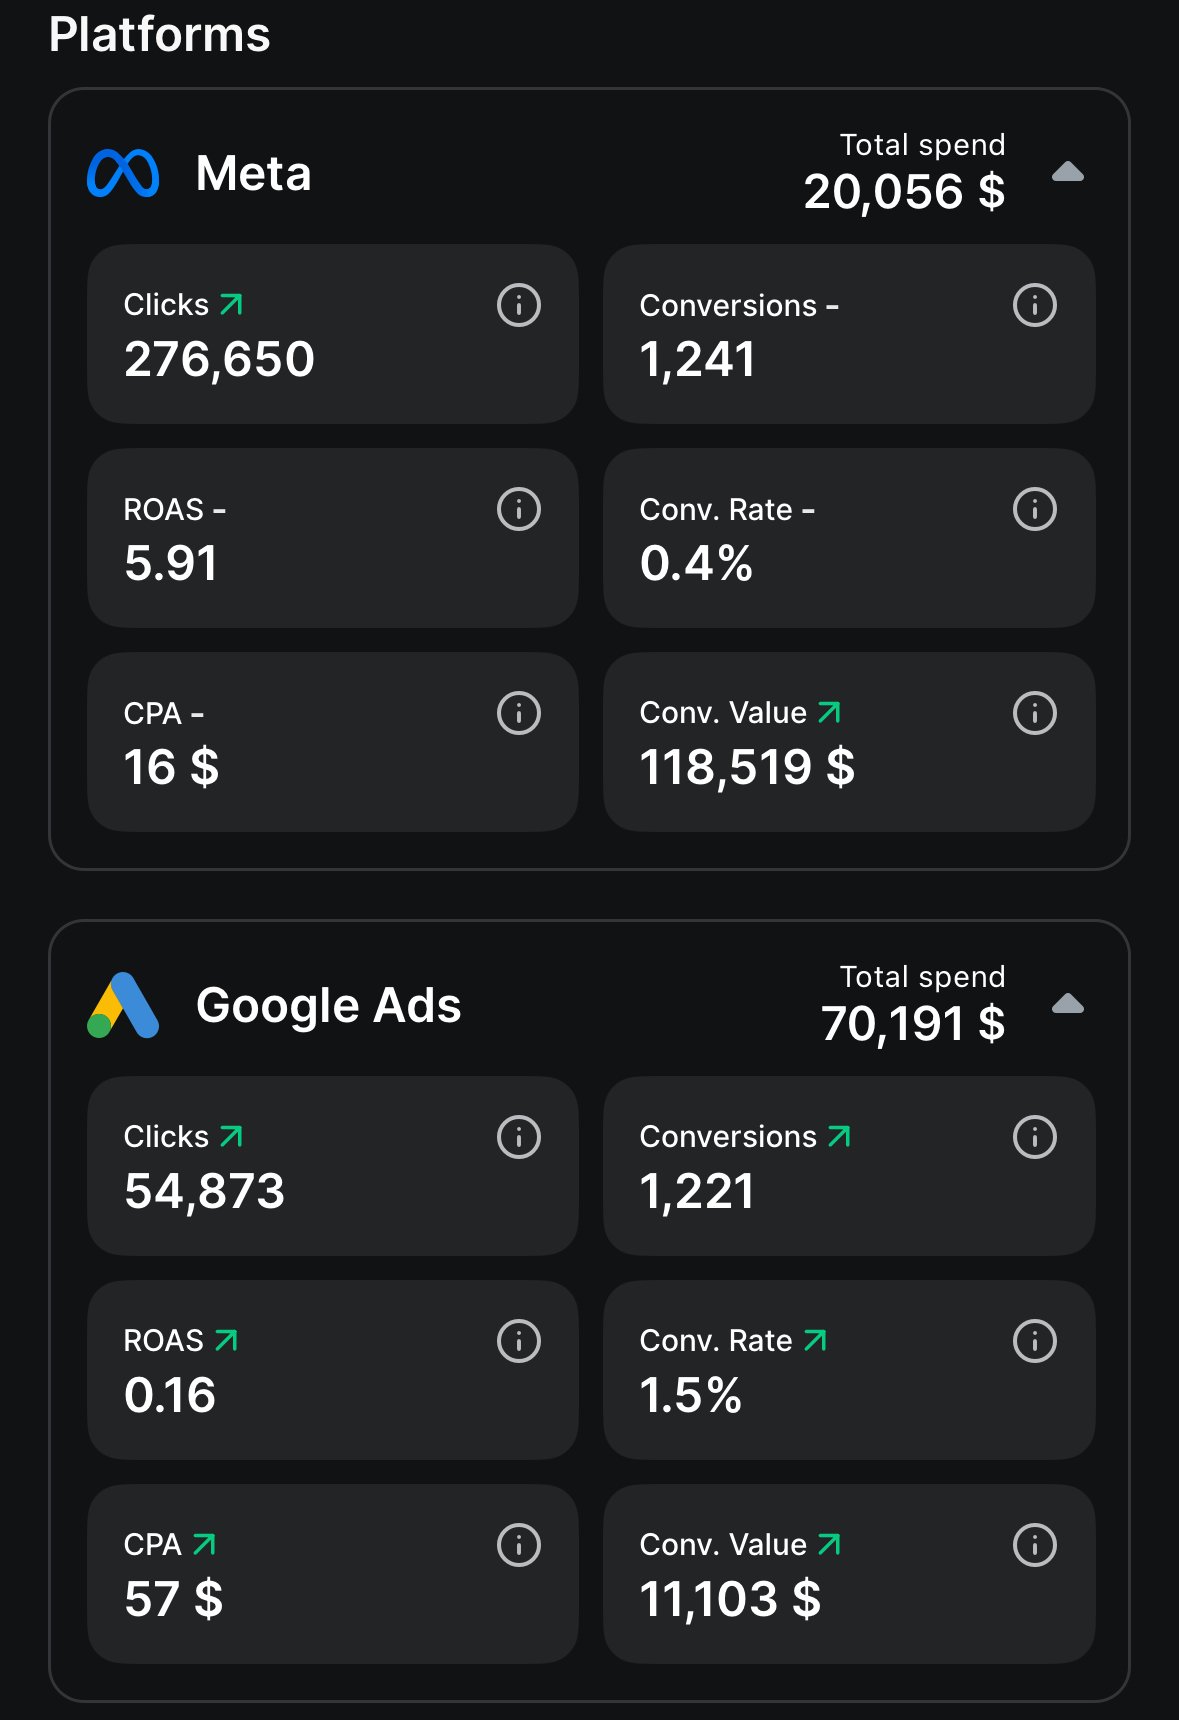
- Platform Breakdowns: Separate cards for each connected ad channel (e.g. Meta, Google Ads) show granular metrics: Clicks, Conversions, ROAS, Conversion Rate, CPA, and Conversion Value. In the image, both Meta and Google Ads have identical figures for illustration, but in practice StatHubs pulls live data from each account. This per-platform view helps teams drill into which ads are driving sales.
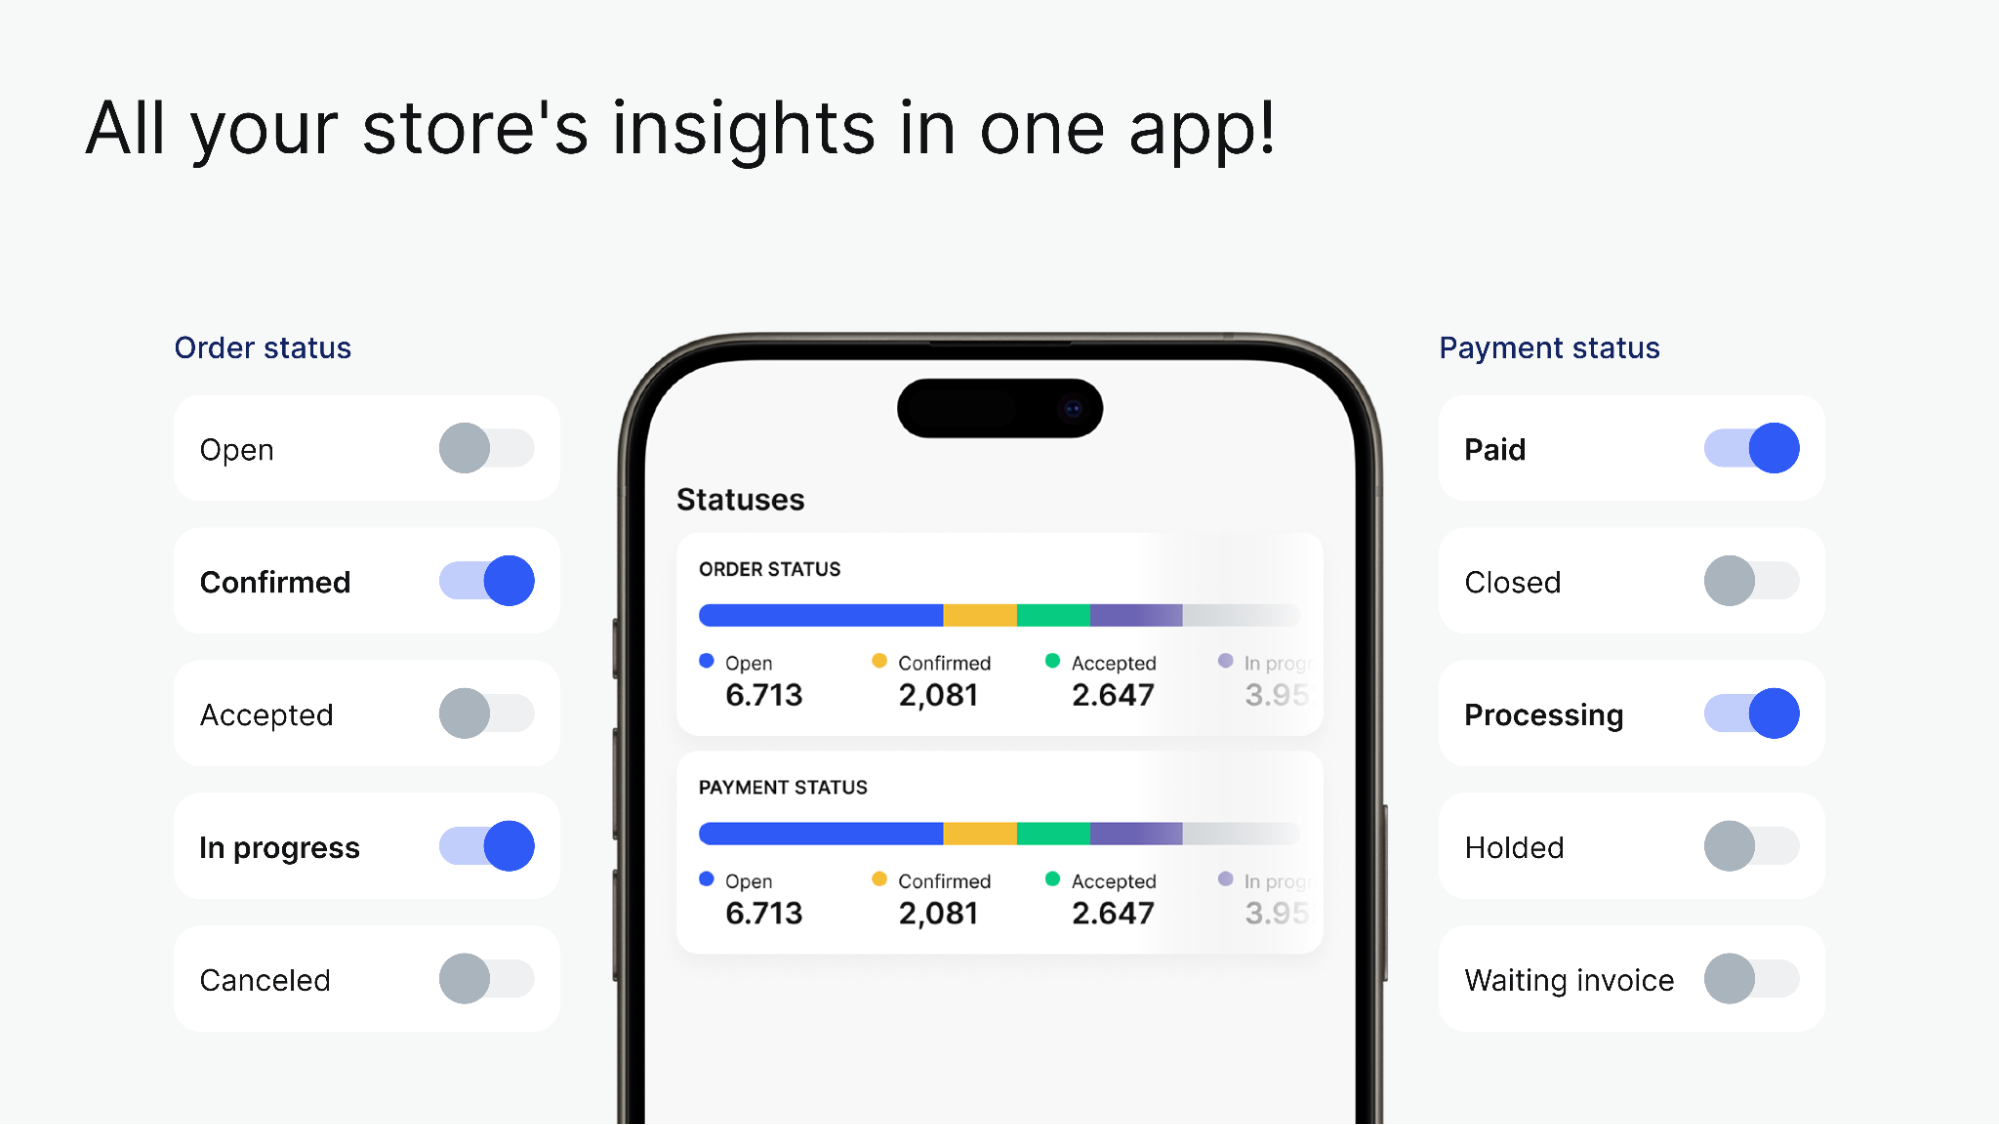
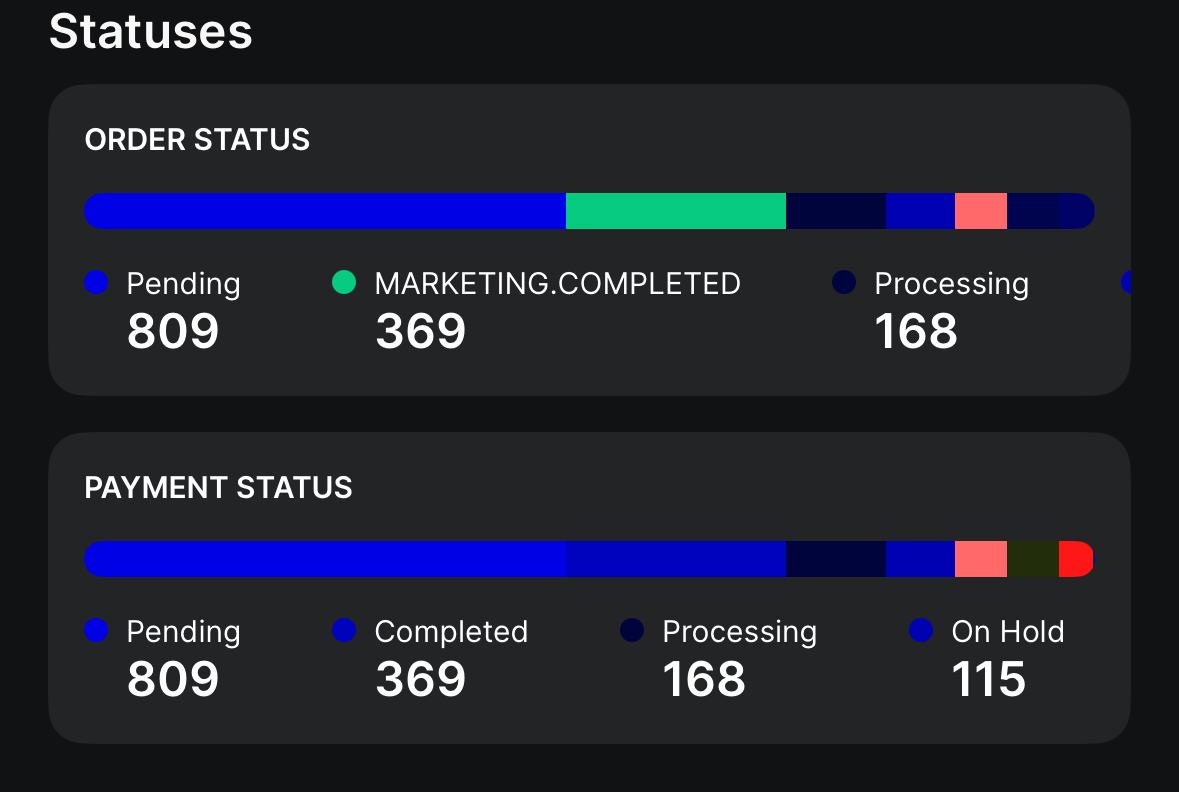
- Statuses: At the bottom, Order Status and Payment Status bars show counts of orders in each state (Open, Confirmed, Accepted, In Progress, etc.). This visual status report lets merchants gauge fulfillment and payment health at a glance (if many orders are “Open” or payments “On Hold”, it stands out).
The interface as a whole is designed for mobile-first usability: large fonts, simple charts, and collapsible sections for easy navigation. Each card often links to detailed reports (e.g. a full sales chart if you tap the turnover number). The app also includes “Comparison Blocks” – toggles to compare current period to previous (day/week/month) at the top. All of these UI elements (dashboards, charts, cards) turn complex data into a clear, action-focused layout. As Putler notes, well-designed dashboards present “key metrics, data points, and performance indicators… in an easy-to-understand manner” for quick decision-making.
Integration Setup and Shop Management
StatHubs provides a unified interface to manage all connected shops and integrations. The All Shops screen lists each active store (e.g. “Shopware – WRST BHVR”) with its eCommerce platform indicated. Users see toggles showing which marketing connectors are enabled (Meta Ads, Google Ads, Google Analytics, TikTok, etc.), and can switch any shop on or off. Shops marked as default will be the first shown in dashboards. From this panel, adding a new shop is easy via the “+ New shop” button.
Clicking a shop opens Shop Details. Here you can edit store information (name, platform type, URL, currency, API keys, etc.). Beneath, toggle buttons or “Connect” links let you link ad accounts: for example, clicking “Connect” next to Meta Ads launches the Meta OAuth dialog to authorize Stathubs. Once connected, the button changes to “Connected” with a status dot. This ensures all data flows continuously without re-authentication.
If you choose to add a new shop, StatHubs prompts you to “Select shop system” (Magento, Shopify, etc.) and enter credentials. For platforms like Shopware, a companion plugin can generate a QR code for secure linking. This setup form is mobile-friendly, with fields for Client Key and Secret Key, matching the credentials needed for API access. After tapping “Create shop” (or scanning a QR code), the new store appears in the list and begins syncing automatically.
This integrated setup means once a shop and its ad accounts are connected, StatHubs handles data collection in the background. There’s no need for manual exports or scheduled tasks – the app provides “fast and easy access” to all revenue and KPI data. Because connectivity is one-time and automated, StatHubs remains in sync without extra effort, making cross-platform analytics truly seamless.
Stathubs Integrations with E-commerce Platforms
StatHubs integrates seamlessly with popular e-commerce platforms, allowing you to pull real-time data like orders, revenue, and customer details into one powerful dashboard. Below are the supported platforms and quick links to integration guides:
Shopware 6:
StatHubs connects to your Shopware 6 store via the Shopware API, importing all your store’s data (orders, products, customers and revenue) into a unified dashboard. It delivers real-time sales analytics and combines those with your marketing metrics, so you can view key KPIs (revenue, ROAS, conversion rates, etc.) all in one place. For setup, see the official Shopware 6 Integration Tutorial.
👉
Shopware 5:
StatHubs also supports Shopware 5, pulling order and revenue data through the Shopware 5 API or plugin. This gives shop owners a live overview of sales and customers along with integrated ads data (Google Ads, Meta, etc.) in a single app. You can follow the Shopware 5 Integration Tutorial for step-by-step instructions.
👉
Shopify:
StatHubs provides an easy one-click Shopify integration that automatically imports your Shopify orders, customers, products and revenue data. The app then shows live Shopify sales alongside your ad spend and campaign performance, giving merchants a consolidated dashboard of key metrics (revenue, ROAS, conversion rate, etc.). See the official Shopify Integration Tutorial for details.
👉
Magento:
StatHubs syncs with Magento stores by using the Magento API to fetch orders, products, customer details and revenue figures. This feeds a real-time dashboard of your Magento shop’s performance, unifying sales and advertising metrics so you see all vital KPIs (like total sales and ROAS) in one view. The Magento Integration Tutorial on the StatHubs channel explains how to connect your store.
👉
WooCommerce:
You can connect any WooCommerce site to Stathubs using the WooCommerce REST API. StatHubs pulls WooCommerce orders, products and revenue into its app and merges them with your connected marketing data. This lets teams monitor WooCommerce sales and advertising KPIs in real time (all essential metrics in one view). For setup, refer to the WooCommerce Integration Tutorial.
👉
BigCommerce:
StatHubs also supports BigCommerce stores via API, syncing orders, customers and revenue from your BigCommerce shop. The data populates a combined dashboard of sales and marketing KPIs in real time, so you can track BigCommerce performance alongside ad spend and conversions. For instructions, see the BigCommerce Integration Tutorial on the official StatHubs channel.
Conclusion
In a data-driven eCommerce world, having timely, unified insights is not a luxury, it’s a necessity. Stathubs answers the call for a comprehensive eCommerce analytics dashboard. It solves the problem of fragmented data by centralizing sales, marketing, and site metrics in one place. This translates into clearer ROI calculation, faster reaction to trends, and easier scaling.
Whether you run a Shopware store, manage multiple Shopify shops, or juggle cross-platform marketing campaigns, StatHubs streamlines your analytics. It simplifies daily workflows for owners, marketers, agencies, and developers alike. By unifying your data sources and providing real-time performance monitoring, Stathubs turns mountains of data into meaningful action steps.
Don’t waste another day toggling between tools or wrestling with spreadsheets. Take control with StatHubs and drive your online business forward with confidence. Try Stathubs today, sign up for a free trial, connect your first store, and experience the power of unified eCommerce analytics. Stay ahead of the competition with smarter insights and faster decisions.
Related posts
 E-Commerce Impulse Buys Guide: Boost Your Sales with Effective Strategies and Smart Tools
 Magento to Shopify Product Migration: Complete 2025 Guide to Import & Export
 Magento to Shopify Migration – The Ultimate Guide
 Selling on Shopify vs. Etsy: Which Platform Fuels Scalability and Business Expansion?
 Everything You Need to Know About Shopify Authenticator App
 Shopify vs. Etsy: The Ultimate 2025 Showdown for Online Sellers + Checklist
 Etsy vs. Shopify: Which Platform Wins the Marketing and SEO Game?
 How to Dropship on Shopify: Step-by-Step Guide for Beginners (2025)