Node.JS Debugging Tools
In software development, the process of finding and resolving bugs is called debugging. Since various defects prevent whole systems from correct operation, the role of debugging is difficult to overestimate. The complexity of this process depends on several factors, such as the size of the system, its structure, the way how it interacts with other systems, etc. Therefore, modern developers know and use a lot of debugging techniques and tools. In the following post, we discuss basic aspects related to this complicated process and introduce you to the most reliable debugging tools for Node.js. Let’s start our journey with the debugging algorithm.

Table of contents
The Algorithm
The first step of debugging consists in reproducing the problem. Sometimes, it requires a lot of time and effort to achieve this goal, especially in case of parallel processes or unusual problems. Specific environments can complicate the task as well.
When you are done with the first step, it is often necessary to simplify the input of the program and make it easier to debug. Let’s look at the example with a compiler and a large source file. Imagine the situation when the compiler crashes while trying to parse the file. However, after some magic with the test case, you can discover that only few lines from the original source file are responsible for that crash. Then, you remove some parts of the original test case and check if your problem still occurs.
Now, it’s time to examine program states and find out the origin of the problem with the aid of a debugging tool. Besides, you can use tracing as an alternate solution. In simple cases, it consists of only a few print statements aimed to output the variables values at certain points of program execution.
Debugging Techniques
Popular debugging techniques are:
- Print debugging. This debugging technique is also called tracing. It consists in watching trace or print statements, that indicate the process execution flow.
- Remote debugging. The name of this techniques speaks for itself: it requires connecting to a remote system over a network to find and fix the problem.
- Post-mortem debugging. With post-mortem debugging, you can easily find and fix problems after the system has already crashed.
- “Wolf fence” algorithm. This popular approach to debugging exists since 80’s and is implemented in the Git version control system as the command git bisect. It required dividing the system into 2 equal parts. After the first segmentation, you find out what part of the system contains the problem and split it once more. It is necessary to repeat the procedure until you find the bug.
- Delta Debugging. This is a technique of automating test case simplification.
- Saff Squeeze. This one helps to isolate failure within the test with the aid of the failing test parts progressive inlining.
Node.js Debugging Tools
Below, you will find the list of the most popular debugging tools for Node.js. Since the Firebear team is passionate about this relatively new platform, we’ve tried to gather all possible solutions that will be helpful in your Node.js development.
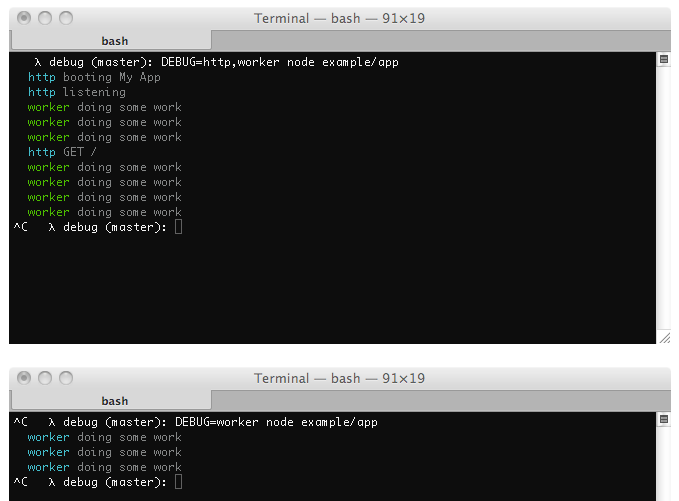
Debug by Visionmedia
Debug by Visionmedia is a tiny utility for Node.js debugging. The tool is aimed at both libraries and apps. Besides Node.js, Debug by Visionmedia is also suitable for working in a browser. Follow the link below for further information.
Node Inspector
Node Inspector is a reliable debugger for Node.js apps based on the Blink Developer Tools – a powerful JavaScript debugging interface. Using this tool you will be able to navigate through your source files; set, enable, or disable breakpoints; specify trigger conditions; inspect and edit variables and object properties. Furthermore, Node Inspector provides the ability to display an expression’s value in a tooltip by hovering your mouse over the expression in your source. Other useful features of this Node.js debugger are:
- Step over, step in, step out, resume;
- Break on exceptions;
- Continue to location;
- CPU and HEAP profiling;
- The inspection of network client requests and console output.
Since this Node.js debugger relies on WebSockets, there is no polling for breaks. It also supports the aforementioned remote debugging, live edit of running code, and breakpoints for files that are not loaded into V8.
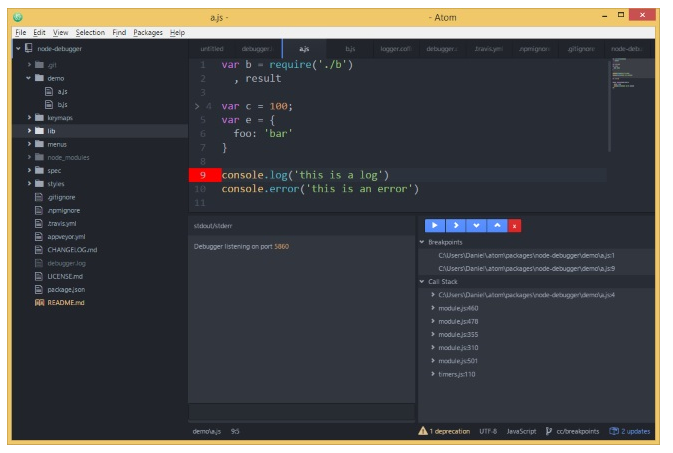
Atom Node Debugger
Atom Node Debugger is a simple debugging tool for both Node.js and io.js, which is very convenient for daily use. You only have to open your JS file and execute the start-resume command by clicking F5. The command will launch the Node.js debugger, and its debug panels will show up. Then, you will be able to set breakpoints, resume debugging, and perform other actions necessary to find the problem. You can find more information about Atom Node Debugger on its GitHub page.
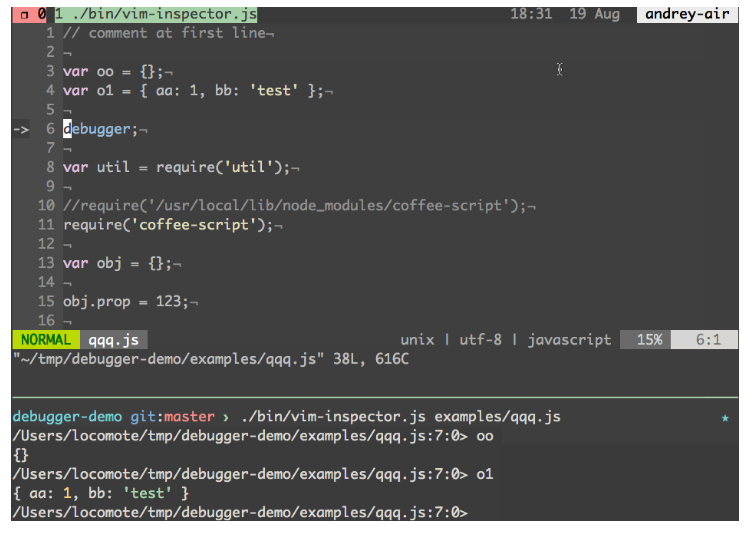
Node Vim Debugger
Node Vim Debugger is a Node.js debugging client which offers a step-by-step approach to debugging from vim. Follow the link below to get all necessary instructions related to its usage.
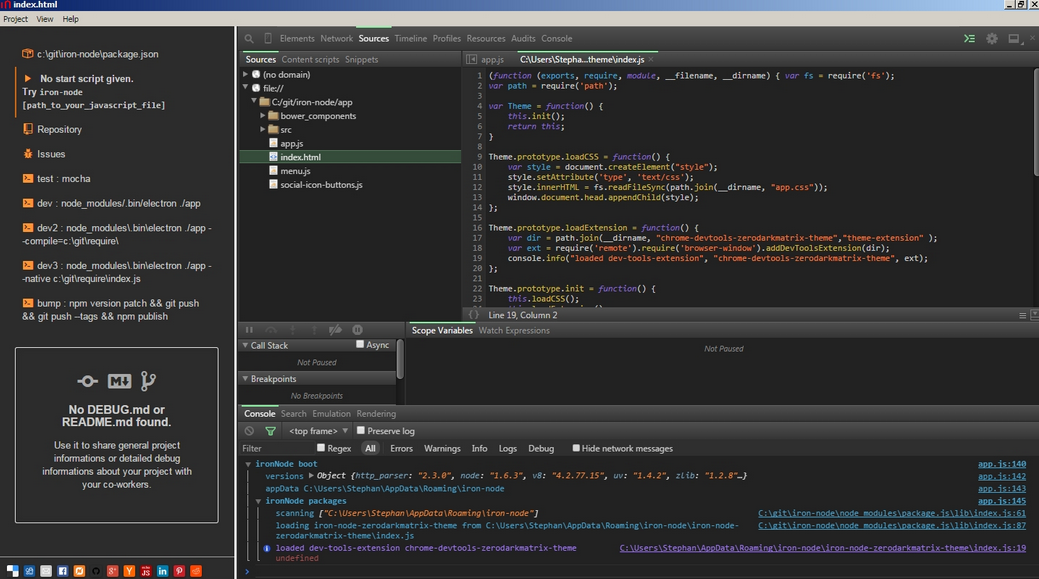
ironNode
I you hate a common Node.js debugging algorithm with its endless processes attaching, files watching, and processes restarting, than you should pay attention to ironNode. The debugger combines the power of JavaScript debugging with Chrome Developer Tools. Thus, you can easily debug Node.js applications with CDT on Windows, Linux, and OS X. Besides, it supports ES2015 out-of-the-box.
Node.js Tools for Visual Studio
If you prefer working within Visual Studio, you can easily turn it into Node.js IDE with the NTVS plugin. Although the solution is designed, developed, and supported by Microsoft, it is free and open source. This Node.js debugging tool offers all necessary features, such as editing, profiling, debugging locally and remotely. Besides, NTVS supports Azure Web Sites and Cloud Services; Intellisense, TypeScript, and npm.
Theseus
With Theseus, the JavaScript ecosystem recieved an absolutely new type of debugging tool which works with both Node.js and Chrome simultaneously. The extension is aimed at the Brackets code editor and offers the following revolutionary features:
- Real-time code coverage;
- Retroactive inspection;
- Asynchronous call tree.
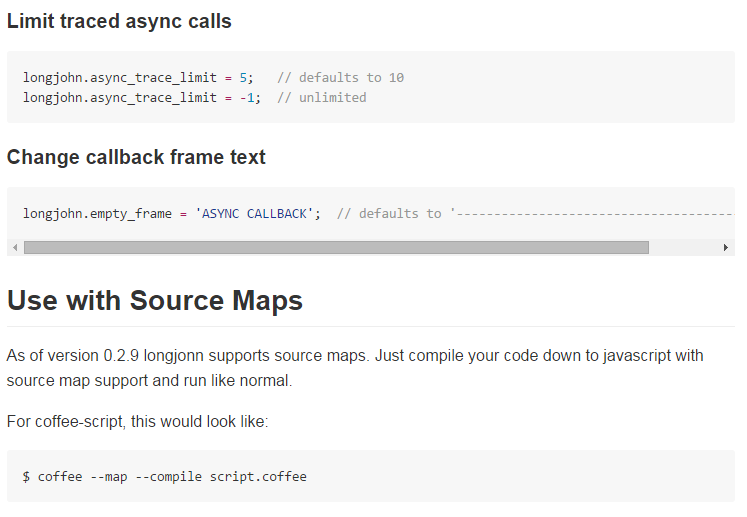
Longjohn
As for Longjohn, it provides useful stack traces with configurable call trace length by collecting large amounts of data. This Node.js debugging solution was elaborated for development and testing environments. Since Longjohn puts a lot of strain on V8’s garbage collector, it slows down heavily-loaded apps, therefore it is not recommended to use it in production.
Jstrace
Jstrace offers a dynamic tracing for JavaScript and provides you with an insight into Node.js app at three levels: process, machine, and cluster. Since this tool is similar to dtrace and ktap, it monitors large sets of data from live processes to help developers find out the reason of a problem. Jstrace supports both local and remote execution, offers minimal overhead when idle, and provides flexible scripting capabilities. Other debugger’s features are:
- probe name and pid/process title/hostname filtering;
- map/reduce style reporting with remote messaging;
- multi-process support and real-time cluster inspection.
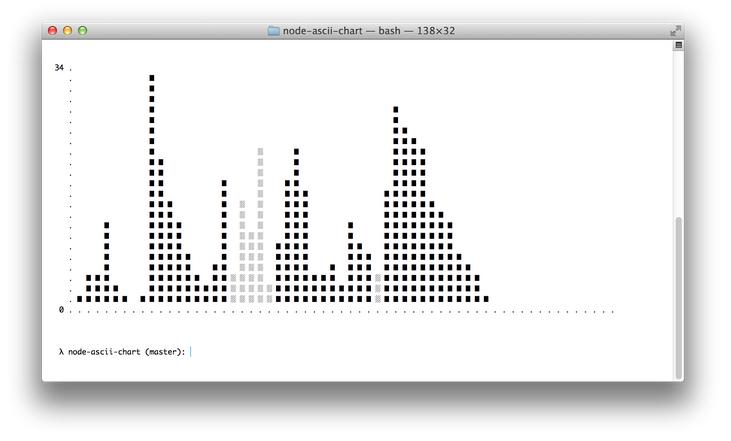
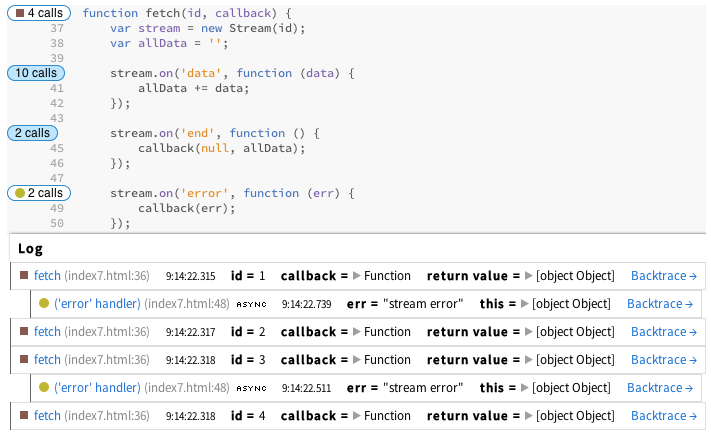
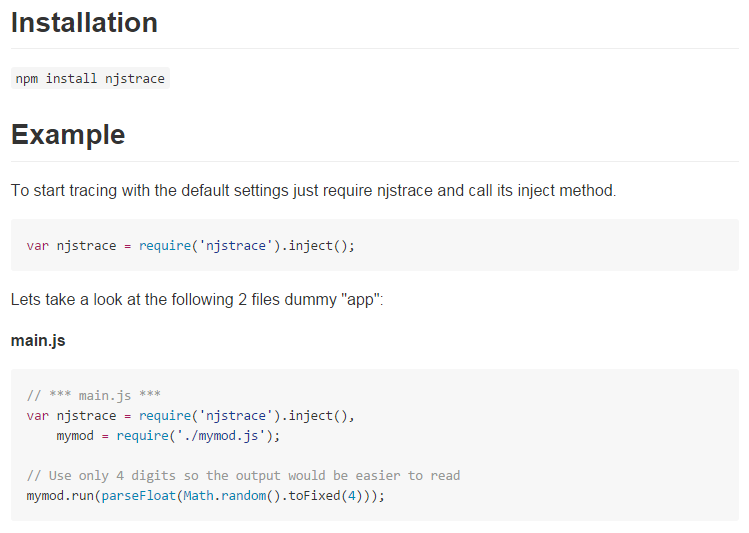
njsTrace
With njsTrace, you will turn Node.js tracing and instrumentation into a piece of cake. The debugger provides the ability to see all function calls, return values, arguments, the time spent for each function. njsTrace is detaily described on its GitHub page. The information listed there covers such important topicks as installation and usage, including njsTrace object and formatter.
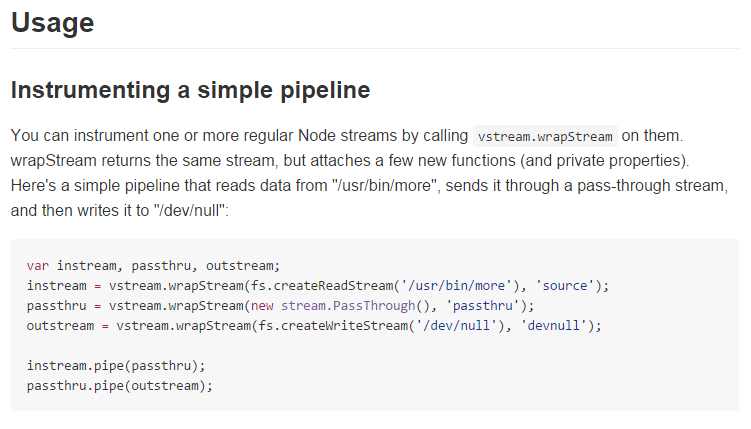
Node vStream
Node vStream will be helpful when you are working with Node streams, because it provides the ability to inspect a pipeline by streaming mix-ins. Instrument one or more regular Node streams by calling vstream.wrapStream on them and get the same stream but with attached functions and private properties.
Stackman
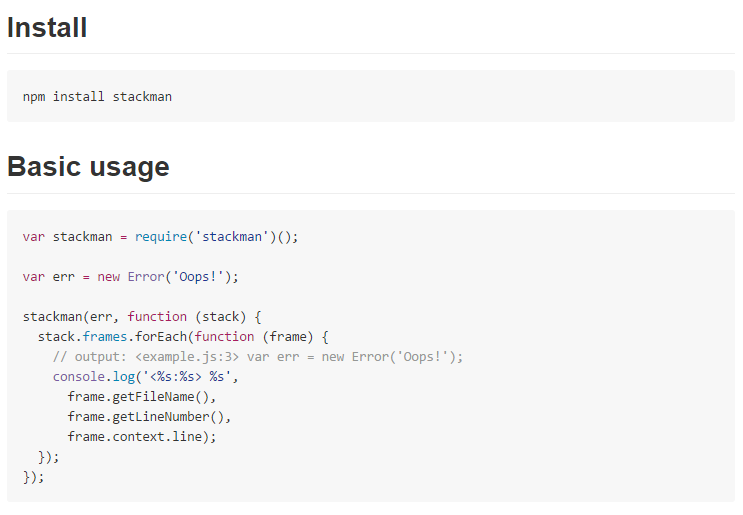
Stackman helps to debug errors by providing an array of stack frames. Each frame in the stack trace offers detailed information necessary for solving a problem. As a developer, you get access to the actual source code with surrounding lines for a place where your error occurred. Stackman shows if it happened in Node.js, inside a 3rd party module, or in your code. For further information, check out the debugger’s page on GitHub.
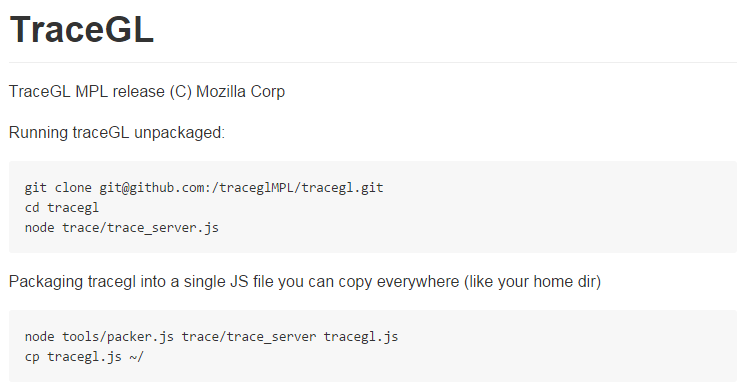
TraceGL
TraceGL relies on monitoring code injected into your JavaScript that produces a log of everything that happens within the system. With the aid of the traceGL Node.js process, the log is streamed from your target (it can be a node or a browser) to the UI, which is based on the webGL technology for rendering and displaying everything rapidly.
Node.js Debugging Guides
It is also necessary to mention guides and tutorials aimed at Node.js debugging. The following part of our post is based on a by .
- Joyent. The company offers a robust .
- traceGL. You can find everything about interactive stack traces with this tool .
- . Please note that it may not work with Node 0.12
- To install it globally use this command: npm install -g profiler
- Then, start your process with node –prof
- You will get a v8.log file
- Now, it’s time to build nprof run the following command: ~/.nvm/v0.8.22/lib/node_modules/profiler/tools/build-nprof
- The last step requires reading the v8.log profile and giving an output. Use this command: ~/.nvm/v0.8.22/lib/node_modules/profiler/nprof
- . As for CPU and Memory Profiling with NodeTime, it requires the following actions:
- Install the app: npm install nodetime
- Include this: require(‘nodetime’).profile()
- Follow the instructions
- . This is how to use the tool for Node.js debugging:
- First of all, you should install it globally: npm install -g node-inspector
- Then, it’s necessary to run your app in debug mode: node-debug your/node/program.js. Alternatively, you can attach it to a running process: kill -s USR1 <your node process id>
- The next step requires running node-inspector in another terminal window: node-inspector
- Finaly, you can open http://127.0.0.1:8080/debug?port=5858 or debug your Node.js project remotely by replacing 127.0.0.1 with your host. Port 8080 should be opened.
- . A tiny Node.js debugging tutorial for Node Webkit Agent:
- Install to your app: npm install webkit-devtools-agent
- Include: agent = require(‘webkit-devtools-agent’)
- Make the agent active: kill -SIGUSR2 <your node process id>
- Logging Libraries that output Debugging Information: and
- Libraries that enhance stack trace information:
- Flamegraphs: and
- Benchmarks with and
- Remote debugging in real time with
If you have any questions related to Node.js debugging, feel free to ask us in comments below.
Related posts
 Shopify Order Tracking: How to Configure, Automate & Optimize the Post-Purchase Experience
 How to Add Product Variants in Shopify: 3 Easy Steps Explained + Alternative Methods
 How to Add Products to Shopify: Manually, as Duplicates, or via Import
 Shopify Metafields Explained: How to Add, Manage & Import Them
 Shopify POS System: Complete Guide to Costs, Hardware, and Seamless Selling
 What is Shopify Used For in 2025? A Comprehensive Guide to E-Commerce Success
 How Much Does Shopify Cost? Monthly Pricing and Hidden Fees Explained
 AI Revolution in Shopify Imports: Smarter, Faster, Better